Introducing R in three lines
Overview
R is an environment for analysing and visualising data, as well as being a programming language, but it is much more than just that. The following is intended to give a brief flavour of R and to introduce some of its key features.
Read, summarise and plot data in 3 short lines of R code
The input data
Here is a simple 2 column data file with some (made up) exam results for 4 students:
name    score
Alice   56
Bob     76
Clare   80
David   48
Bob     45
Bob     74
Alice   63
Clare   56
David   64
Read in the data
First of all we read the data into R:
results <- read.table("results.dat", header = TRUE)
R automatically picks up the names of each column from the file (via
"header=TRUE"). Unlike many programming languages, there is no need
to loop explicitly over each row of data. Neither do we need to
specify data types or declare the object "results" which stores the
data in R. However, R provides fine-grained control of such details
should you want it (see "?read.table" within R for the relevant help
page).
In this case, "results" is a data frame, which is a very common
data structure in R, resembling a table or spreadsheet of rows and
columns of values, with identical data types in each column.
Summarise the data
Having read in the data, we might want to calculate the mean score for
each student. We can do this easily, using the "aggregate" function:
aggregate(score ~ name, data = results, FUN = mean)
   name score
1 Alice  59.5
2   Bob  65.0
3 Clare  68.0
4 David  56.0
Note here the use of R's formula syntax ("~") for clearly and concisely
expressing that we want to perform some action on the variable
"score", according to the different values in the corresponding
variable "name"; both of these variables are to be found in the
object "results".
In this case, we want to calculate the mean value of "score" for each
name, but you can supply any suitable function to the argument
"FUN", such as sum, min, max etc. or you can write your own
function to use.
Visualise the data
In addition to summarising the data on screen, you typically also want to plot the results as a graph. There are different ways to do this, but R assigns a default style of graph according to the type of object being plotted, in accordance with its object oriented design:
plot(results)
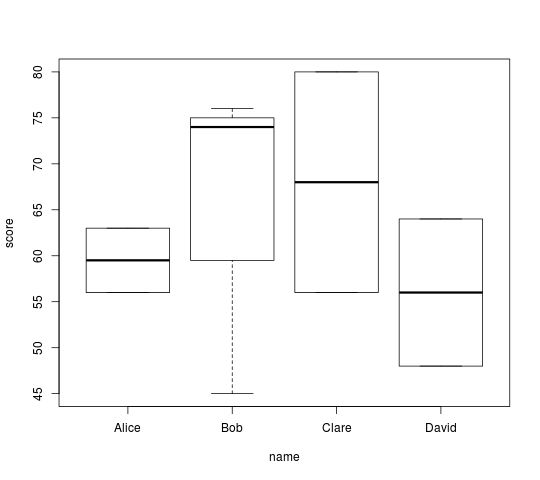
The first 2 columns of the data frame "results" are automatically
used for the X and Y axis data for plotting. Since the "names"
column is not numeric data, R reads it in as a factor by default and
correspondingly produces a boxplot summary of the results for each
student.
Once again, fine control over the plot is achieved with further header
arguments to "plot"; see "?boxplot" and "?par" for the relevant
help pages.
You could plot the same graph explicitly, using the formula syntax from above, as follows:
plot(score ~ name, data = results)
You can find out more about object orientation in R from these help
pages: "?class" and "?S3Methods". For example, try the following
(anything after a "#" is treated as a comment and ignored by R):
class(results)                  # "data.frame"
methods(class = "data.frame")
Summary
So, there you have it, a quick introduction to R in only 3 lines of code!
results <- read.table("results.dat", header = TRUE)
aggregate(score ~ name, data = results, FUN = mean)
plot(results)
You can learn more about R from the R tutorials pages.
Key concepts introduced
- emphasizes the difference between a programming language and a language for computing with data
- R has a concise, intuitive and readily customisable syntax: it enables fine-grained control, but with sensible default choices.
- The data-driven design of R avoids the need to explicitly loop over vector/array elements, declare variables or specify data types etc. (although all these aspects are under user-control).
- use of (well-chosen) column names avoids ambiguity, plus is much more readable and easy to follow (i.e. no references to, e.g. "column 2")
- demonstrates the powerful formula interface, which is central to building models and manipulating hierarchical data structures in R
- introduces data frames: the key data structure in R (see "
?data.frame") - introduces factors, an efficient format for categorical data (see
"
?factor") - introduces the "everything is an object" approach: "
mean" is passed as a function not as a character string; any other appropriate function could be used instead - R is object oriented (plot method), i.e. different "methods" produce
different results, according to the "
class" of the object on which they operate. - R supports and encourages a structured approach to data analysis.
About
This R tutorial is by Alastair Sanderson Ph.D. You can contact me here.